
Zika in Texas during the 2016 Evolution Meeting
This summer’s Evolution Meeting is being held in Austin Texas. Over the past few days, a number of people have asked me about the risk of being infected with zika virus in Austin during the conference. The short answer is that while the risk is probably very low, there is a lot of uncertainty. This uncertainty primarily comes from two places: 1.) we know almost nothing about zika virus transmission and 2.) we don’t have a good grasp on the number of subclinical cases per clinical case. This rate of clinical vs. subclinical–or reported vs. unreported–cases could have a large effect on the expected number of local transmission events because some reports suggest it might be as high as 4 unreported cases for every reported case (see http://www.texaszika.org/ – unfortunately they don’t provide a citation).
The current status of zika in Texas
To date, the Texas Department of State Health Services has reported 32 confirmed cases of zika virus infection in Texas. Of these, 31 were imported cases, meaning the individual was infected outside of the USA, and one resulted from sexual transmission and thus is classified as a local transmission event. There have been no reported zika virus infections resulting from an infected mosquito in Texas.
In terms of location, the majority of zika cases in Texas have occurred in Houston, but two cases have occurred in Austin. Because both of the primary zika virus mosquito vectors, Aedes aegypti and Aedes albopictus, are resident in Austin and because zika virus has shown up, the risk of local transmission is not zero. Nevertheless, based on historical data the risk seems to be quite low.
Some thoughts based on related viruses
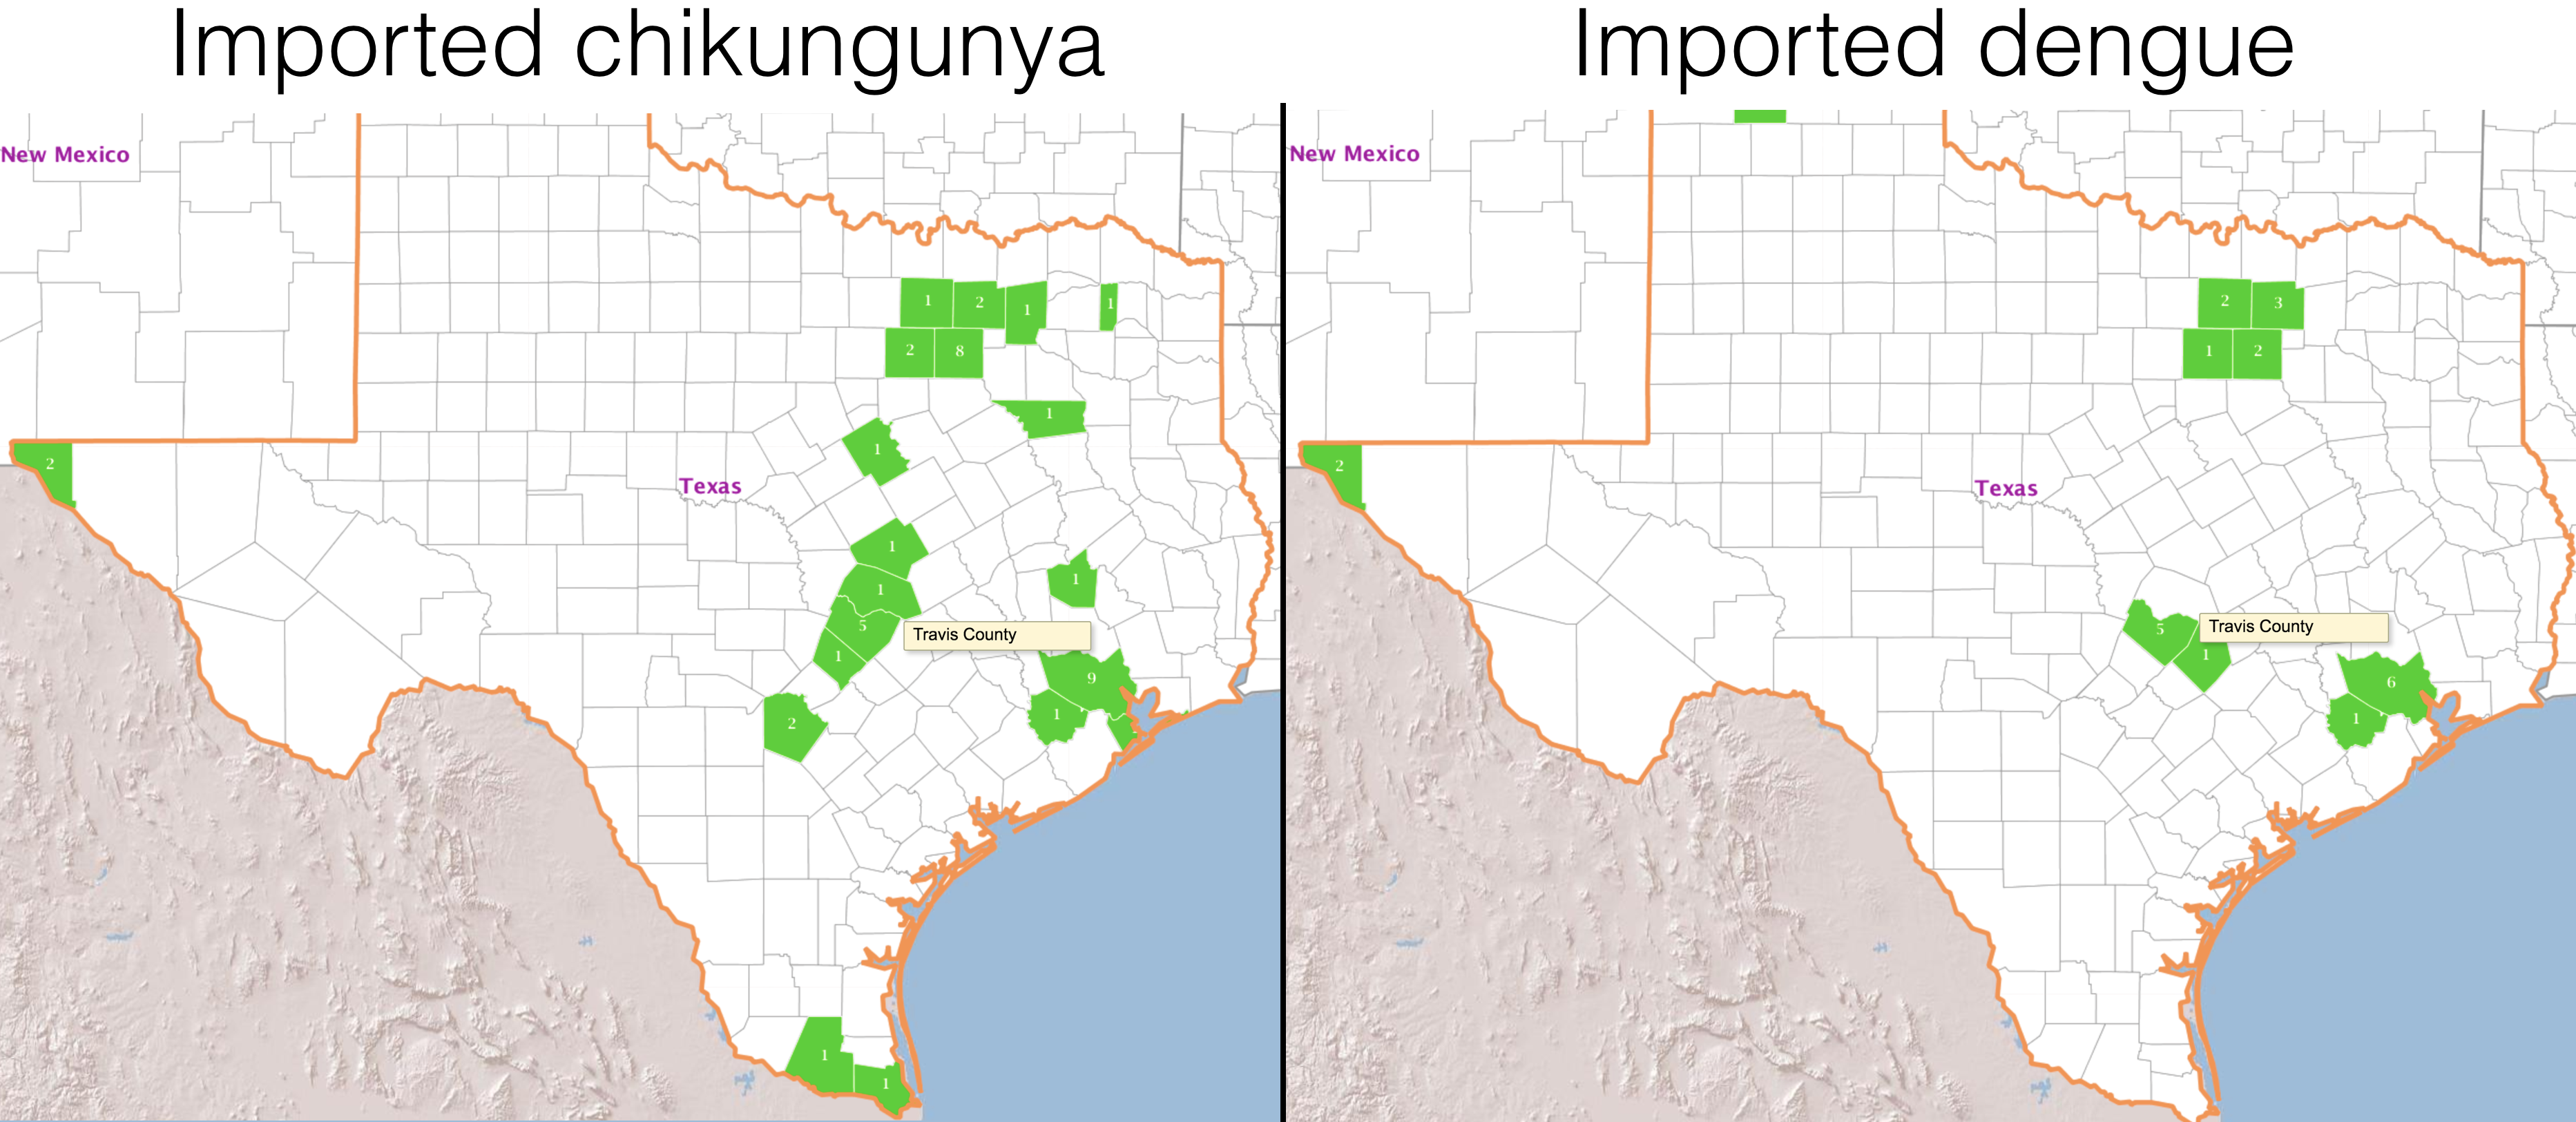
Because dengue and chikungunya viruses are related to zika and–most importantly–are transmitted by the same mosquito vector, historical data on the prevalence of these two viruses may give us some indication of what to expect for zika. Recently, the USGS set up a website for viewing reported human imported and local arbovirus cases in the USA. Based on data from that site, Texas had 24 confirmed cases of dengue in 2015, all imported, and 43 confirmed cases of chikungunya, again all imported, see Figure 1 below. Five cases of dengue occurred in Travis county, which houses Austin, and five cases of chikungunya occurred in Travis county as well. For both diseases, the majority of cases in Texas occurred in the Houston area. Prior to 2015, there were no reported cases of chikungunya in Texas, however between 2010-15 there were 164 imported dengue cases in Texas, 17 of which occurred in Austin. There were no local dengue transmission events in Austin going back to 2010, but there have been local transmission events in southern Texas, around Hidalgo and Cameroon counties, with 24 local transmission events in 2013.
To put this in context, in 2015 the seven southern-most counties in Florida (Miami-Dade, Monroe, Broward, Collier, Lee, Hendry, and Palm Beach counties), which include the city of Miami and have a population of 2.4 million people, saw 53 imported dengue cases and 1 local transmission event and 45 imported chikungunya cases and no local transmission events. For chikungunya, there were no reported cases in Florida prior to 2015, but for dengue there are reports back to 2010. The table below presents the number of imported and local dengue cases, the rate of local cases per 100,000, and the ratio of local to imported cases for dengue virus in the seven southern-most counties in Florida.
Historical dengue cases in southern Florida.
| Year | Imported Cases | Local Cases | Rate of local cases per 100,000 | Local cases per imported |
|---|---|---|---|---|
| 2015 | 53 | 1 | 9.94e-6 | 0.02 |
| 2014 | 49 | 7 | 7.03e-5 | 0.14 |
| 2013 | 75 | 3 | 2.91e-5 | 0.04 |
| 2012 | 85 | 1 | 9.94e-6 | 0.01 |
| 2011 | 34 | 6 | 6.06e-5 | 0.18 |
| 2010 | 86 | 58 | 5.82e-4 | 0.67 |
Figure 1
A back of the envelope calculation
Because we are dealing with an infectious disease, there is probably a sharp transition–from below one to much great than one–in the ratio of local to imported cases. For example, the 24 local dengue transmission events I mentioned in southern Texas came from 21 imported cases. As a result, a possible indicator for when to worry about sustained local transmission is when the prevalence of imported cases crosses above some critical value. The data from southern Texas suggests this might be around 0.0002 cases per 100,000 people. Interestingly, the largest number of local dengue cases occurred in southern Florida due to 86 imported cases, corresponding to 0.0009 cases per 100,000. Because both values are the same order-of-magnitude, I’m prepared to believe that this is a reasonable guess at our critical threshold. Combining this threshold with the population of Austin yields a threshold of between 19 - 90 imported cases. Now you see why the reporting rate of infectious cases matters. If there are actually four unreported cases for every reported case, then Austin is nearly at the threshold for an outbreak of local transmission. However, if we assume the same parameters as dengue, then the outbreak would yield well under 100 local cases in Austin (or around 2.5e-4 per 100,000).
A more sophisticated estimate from the Texas Arbovirus Risk Map
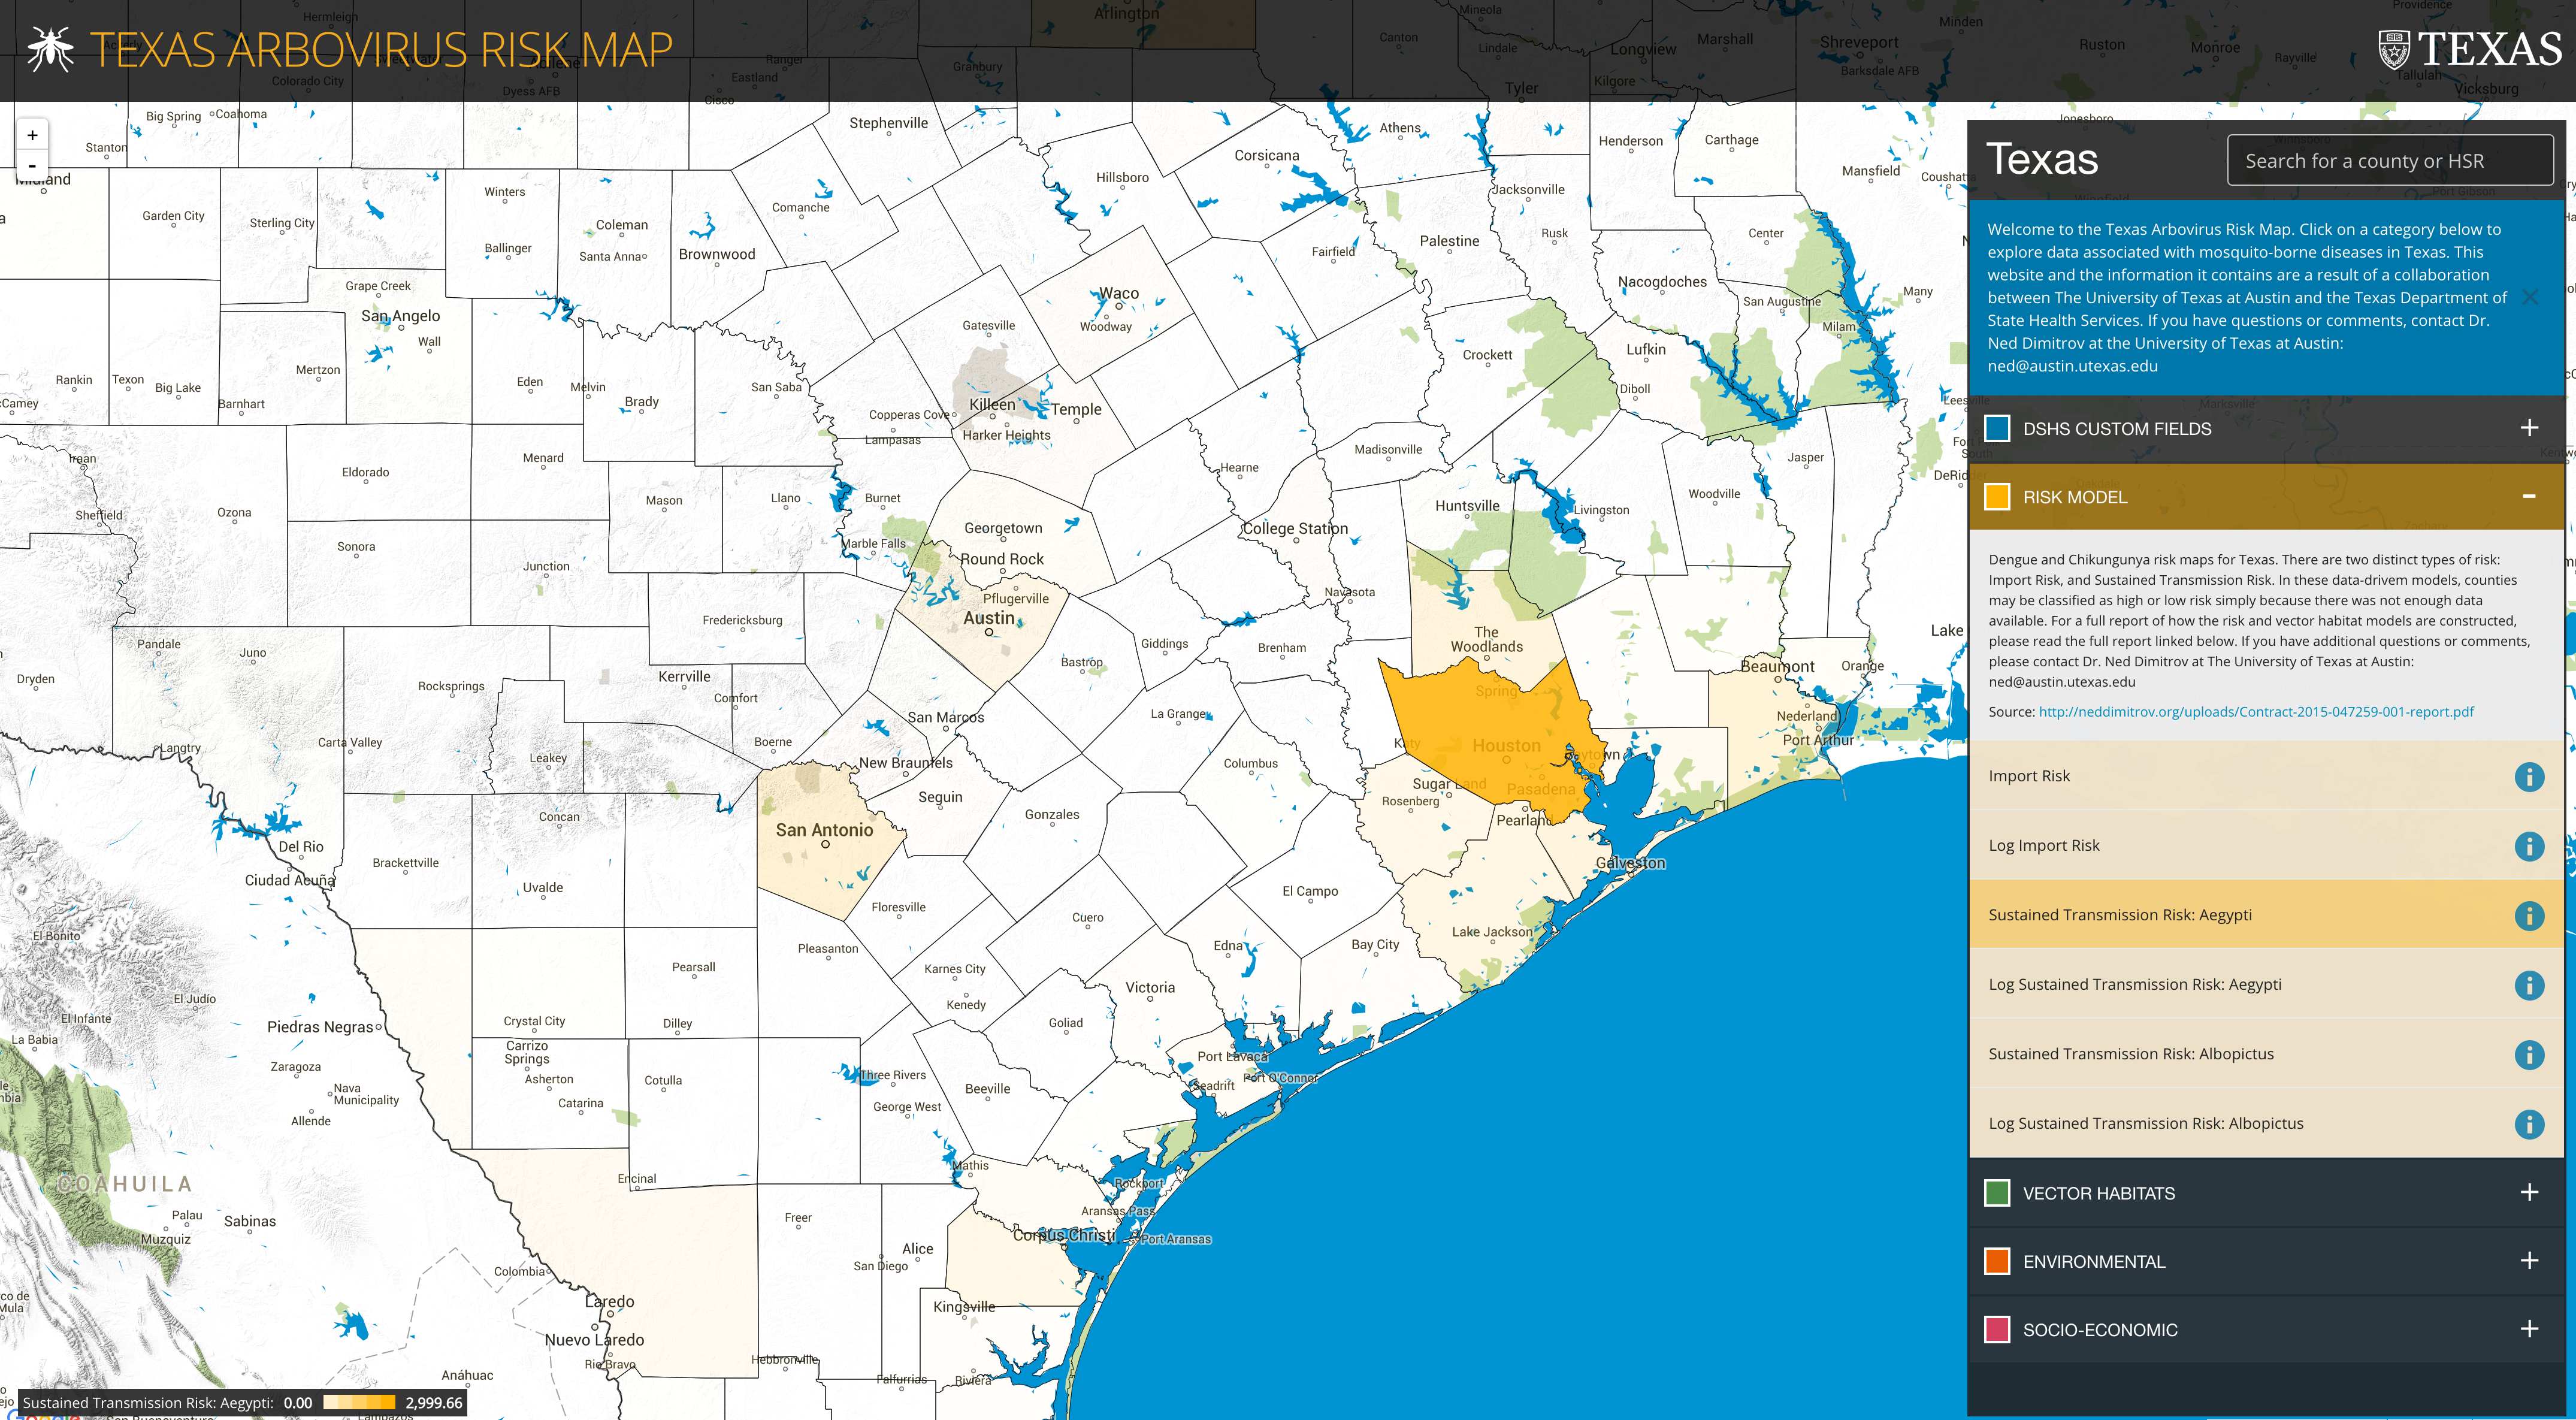
Last year, Lauren Ancel Meyers’ research group at UT Austin built an arbovirus risk map for Texas. This map incorporates historical data on vector abundance, vector habitat suitability, human and vector-borne cases, socioeconomic factors, etc. to generate a risk map for importation and spread of a generic arbovirus. You’ll note in Figure 2 that the risk of local transmission around Austin isn’t zero (as I said above), but, if you zoom out, it’s about 10 times lower than the risk estimate for Houston and would be about 100 times lower than the risk in S. Florida (that’s a semi-educated guess). A few groups, including Lauren’s, are working on a more detailed, zika-specific risk analysis for Texas, which I will link to once they are available. However, I suspect what we’ll see is that the risk is low, but that there’s a huge amount of uncertainty because we don’t have a good handle on how many subclinical cases there are for each diagnosed case–i.e. the reporting rate of infectious cases. Sidebar – if groups would share their genome sequence data from the zika outbreak in Brazil, we could estimate the reporting rate of infectious cases.
Figure 2
Closing remarks
Please keep in mind that this post is based entirely on circumstantial evidence and guesswork. The best thing you can do is pay attention to up-to-date data and analysis from the CDC, the Texas Department of State Health Services, and scientific publications. Two useful sites for finding information are the CIDRAP and PLoS collections on zika. If you’re interested in the raw data, both from the USA and globally, the CDC has a git repository. Additionally, men should remember that zika virus may persist in semen for months after infection (Atkinson et al. 2016) and everyone should remember that this disease can be transmitted sexually (D’Ortenzio et al. 2016). In closing, compared to other risks, catching zika in Austin looks to be incredible unlikely, so, remember, panicking based on something that may be unwanted, but is very unlikely, is never a good idea.
Citations
Atkinson B, Hearn P, Afrough B, Lumley S, Carter D, Aarons EJ, Simpson AJ, Brooks TJ, Hewson R. Detection of Zika Virus in Semen. Emerging infectious diseases. 2016 May;22(5):940.
D’Ortenzio E, Matheron S, de Lamballerie X, Hubert B, Piorkowski G, Maquart M, Descamps D, Damond F, Yazdanpanah Y, Leparc-Goffart I. Evidence of Sexual Transmission of Zika Virus. New England Journal of Medicine. 2016 Apr 13.